DIABETIC LIFE INSURANCE HELP CENTER
DIABETIC COVERAGE SOLUTIONS
Which States Have the Most Diabetics??
As of 2022, the prevalence of diagnosed diabetes among adults in the United States varied significantly by state. Here are some key statistics:
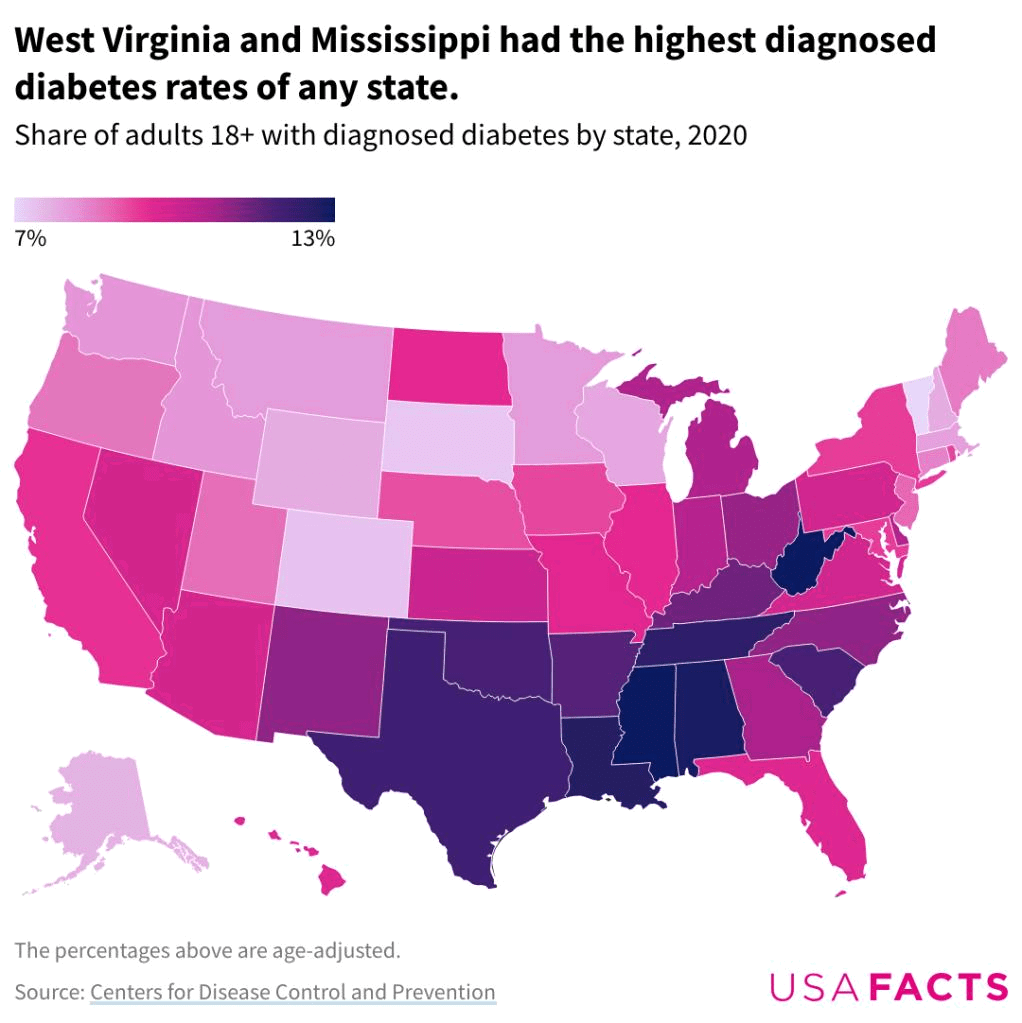
**Highest Prevalence in the United States
- West Virginia had the highest rate, with 17.4% of adults diagnosed with diabetes.
- Other states with high prevalence rates include
- Arkansas (15.7%)
- Alabama (15.5%)
- Mississippi (15.3%)
**Lowest Prevalence in the United States
- Colorado reported the lowest rate at 8.1%.
- Other states with lower prevalence rates include
- Montana (8.4%)
- Vermont (8.4%)
- Alaska (8.7%)
- Utah (8.7%)
**General Trends
- The national average was around 10.5%, with notable regional variations.
- The prevalence of diabetes tends to be higher in the southern states and lower in the western and northeastern states (CDC) (CDC Archives) (America’s Health Rankings).
U.S. States Ranked by the Percentage of Adults Diagnosed with Diabetes in 2022
1. **West Virginia** - 17.4%
2. **Arkansas** - 15.7%
3. **Alabama** - 15.5%
4. **Mississippi** - 15.3%
5. **Tennessee** - 14.8%
6. **Kentucky** - 14.8%
7. **Louisiana** - 13.9%
8. **South Carolina** - 13.8%
9. **Oklahoma** - 13.4%
10. **Georgia** - 13.3%
11. **Texas** - 13.2%
12. **Indiana** - 12.9%
13. **North Carolina** - 12.8%
14. **Missouri** - 12.6%
15. **Ohio** - 12.4%
16. **Florida** - 12.3%
17. **Michigan** - 12.2%
18. **Nevada** - 12.0%
19. **Virginia** - 11.8%
20. **Arizona** - 11.7%
21. **New Mexico** - 11.7%
22. **Pennsylvania** - 11.6%
23. **Kansas** - 11.5%
24. **Maryland** - 11.4%
25. **Illinois** - 11.3%
26. **South Dakota** - 11.2%
27. **Iowa** - 11.1%
28. **Nebraska** - 11.0%
29. **Wisconsin** - 10.9%
30. **Delaware** - 10.8%
31. **Minnesota** - 10.7%
32. **North Dakota** - 10.6%
33. **New York** - 10.5%
34. **California** - 10.4%
35. **Washington** - 10.3%
36. **Colorado** - 10.1%
37. **Oregon** - 10.0%
38. **Idaho** - 9.9%
39. **Utah** - 9.8%
40. **Massachusetts** - 9.7%
41. **New Jersey** - 9.6%
42. **Connecticut** - 9.5%
43. **Rhode Island** - 9.4%
44. **Montana** - 9.3%
45. **New Hampshire** - 9.2%
46. **Vermont** - 9.1%
47. **Maine** - 9.0%
48. **Alaska** - 8.9%
49. **Hawaii** - 8.8%
50. **Wyoming** - 8.7%

These statistics illustrate the higher concentration of diabetes prevalence in the southern and southeastern regions of the United States.
(CDC Archives) (America’s Health Rankings) (Diabetes.org)
These variations are influenced by factors such as socioeconomic status, education levels, and access to healthcare. For example, states with higher poverty rates and lower levels of educational attainment often show higher rates of diabetes. This underscores the importance of targeted public health interventions and education to manage and reduce the incidence of diabetes across different regions.
Diabetic Coverage Solutions
We specialize in getting diabetics approved for life insurance...
Be sure to view our Privacy Policy.
Our Partners
All rights reserved to:
Diabetic Coverage Solutions is owned and operated by Excel Advisors LLC and Excel Media Company.
1985 Riviera Dr.
Ste. 103-1034
Mount Pleasant, South Carolina
PH: 843-256-2495 (text only)
EMAIL: go.excelmedia@gmail.com


